Dashboard
Dashboard enables you to view graphically, how the application is used within an enterprise. You can view reports, metrics and key performance indicators (KPIs).
Note: If you have configured Control Panel and you are unable to update the settings in Process Runner Excel Add-in, contact your Control Panel administrator. For more information about how to edit the settings in Control Panel, see Innowera Control Panel Help.
To connect to an Dashboard instance
- In Process Runner Excel Add-in, select Tools > Options. The Options window is displayed.
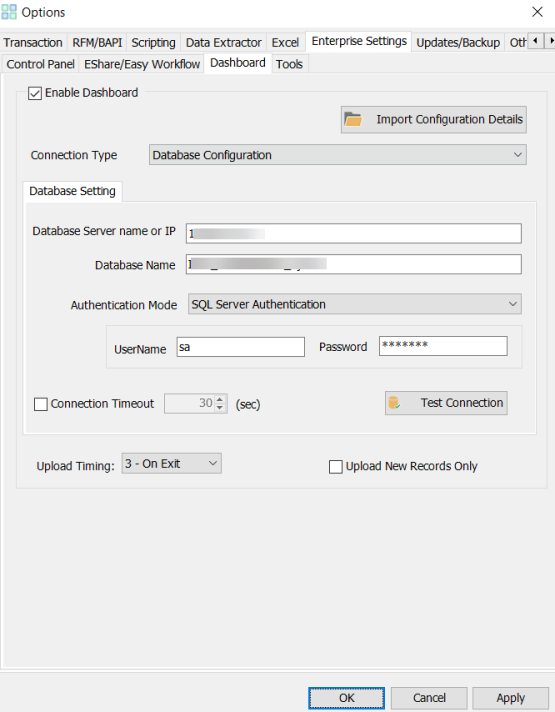
- On the Enterprise Settings > Dashboard tab, select Enable Dashboard. The options in the window are available.
- Optionally, select Copy from EShare. The configurations of the EShare tab are copied to the Database Setting of Dashboard tab.
Note: Copy from EShare is available only when EShare in the Tools > Options> Enterprise Settings window is selected.
- If you select Import Configuration Details, specify the path of
DashboardConfig.icffile to configure Dashboard in Process Runner Excel Add-in. The configuration information about Dashboard is displayed in the different boxes of Database Setting or Service Setting.Note: You must get
DashboardConfig.icffile from your Dashboard administrator. - If you select Database Configuration in Connection Type, enter the following details:
- Database Server name or IP: Indicates the host name or IP address where Dashboard is installed. Specify the port number if you are not using the default value of
1433by including a comma after the IP address or host name. For example,199.xx.yy.xxx, 11111 - Database Name: Indicates the name of the Dashboard database.
- Authentication Mode: Indicates the authentication mode that must be used to connect to Dashboard. For SQL Server Authentication, user name and password are also required.
- Connection Timeout: Indicates the time to wait while trying to establish a connection before terminating the attempt and generating an error.
- Database Server name or IP: Indicates the host name or IP address where Dashboard is installed. Specify the port number if you are not using the default value of
- If you select Service Configuration in Connection Type, enter the following details:
- URL: Indicates the server URL of the Dashboard instance.
- Use Default: Indicates that the default credentials are used to sign into Dashboard. The User Name and Password boxes are not available for this option.
- User Defined: Indicates that the domain name and password are used to sign into Dashboard. Ensure that you get the domain credentials from your administrator.
- Select Test Connection. The configuration details are verified.
- In Upload Timing, select one of the following options:
- Manually: Indicates that the records are uploaded manually.
- End of Each Run: Indicates that the record are uploaded automatically after the successful run of the Process file.
- On Exit: Indicates that if an error occurs in the first collective run file during execution, then Process Runner logs the error in a log file and continue the run of other files in the collective run.
- Optionally, to upload only the new records and therefore eliminate replication of the records, select Upload New Records Only.
- Select Apply > OK. The changes are saved.
Related Topics: