View Gantt Chart
This topic describes how to view the Gantt chart that displays graphically the status of the work item and overall workflow status. Typically, tasks are shown on the vertical axis, and time is represented on the horizontal axis of a bar graph. Color coding indicates the work items that require your attention; you can make informed decisions such as escalating the priority or reassigning the task to someone else, if you are authorized to do so.
To view Gantt Chart
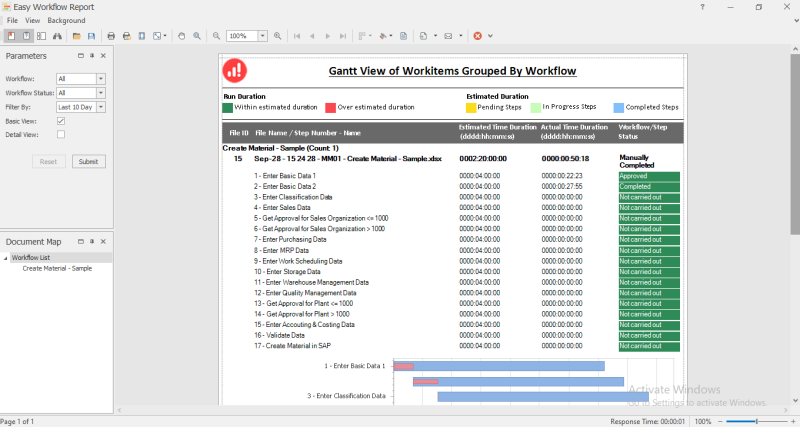
- Select Tools (Workflow) > Reports > Gantt Chart on the Process Runner tab. The Gantt View of Workitems Grouped By Workflow is displayed in the Easy Workflow Report window.
- In the Parameters section, select the following options:
- Workflow: Indicates the workflows based on which the report must be displayed.
- Workflow Status: Indicates whether the Gantt chart must contain the workflows that are pending, completed, or terminated.
- Filter By: Indicates the date range based on which the report must be displayed.
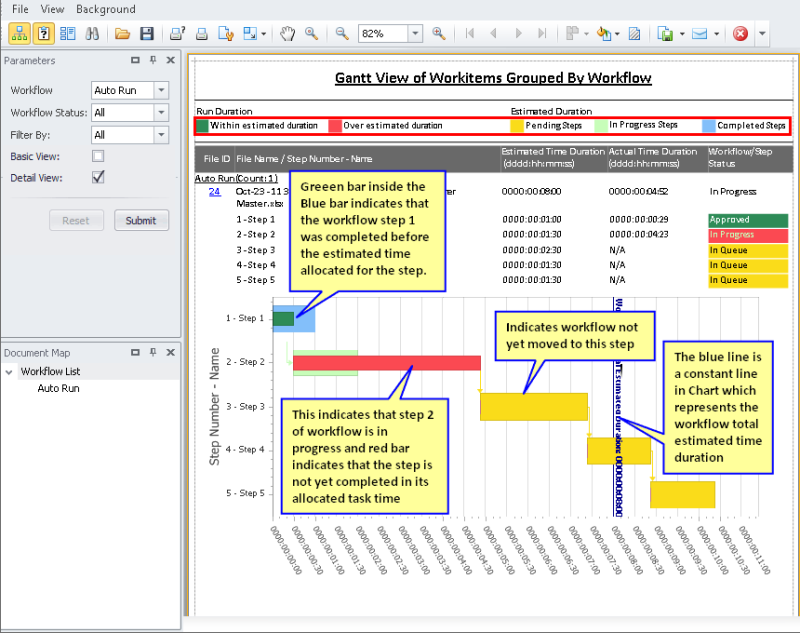
- To view the steps in detail, select Basic View or Detail View; by default, the step details are not displayed in the report.
- To view only the details about the workflow steps that are completed, terminated, or are in progress, select Basic View.
- To view the details about the workflow steps including the delegated and reassigned steps, select Detail View. The detail view also provides additional information such as when the step was reassigned.
- Select Submit. The report is displayed.
- Optionally, in the Document Map section, select a workflow. The report for the workflow is displayed.
- To reset the filters to their default values, select Reset.
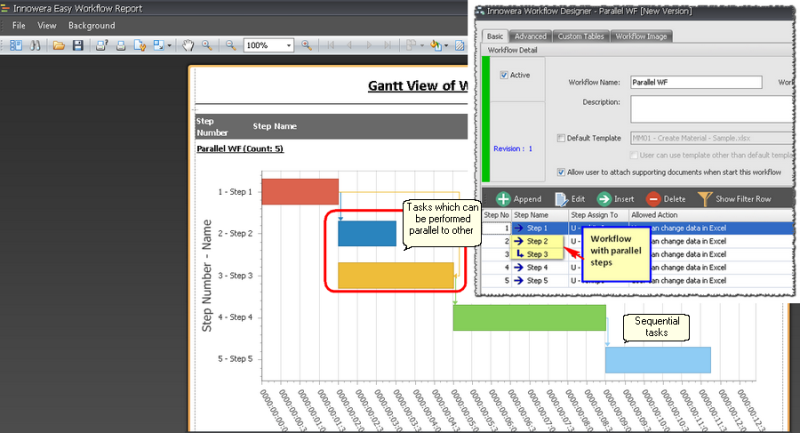
Workflow steps can be sequential or parallel. If parallel processing is implemented in the workflow, then the Gantt Chart showing parallel step is displayed as shown in the following screenshot. Steps 2 and 3 can start in parallel after step 1 is completed.
Related Topics: